(31 kB)
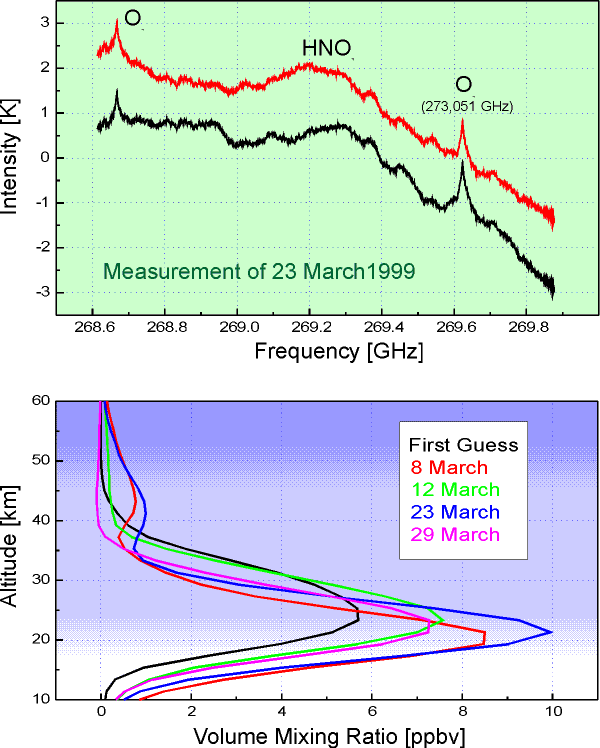
Upper graph: Spectrum measured on 23 March. Black is the raw spectrum, red is the spectrum corrected for standing waves. Lower graph: Retrieved vmr profiles of HNO3 in March 1999.
For comments mail to  |
(last modification: September 19th, 2005) | ||
|
|||